

How to Check Raspberry Pi Health
Keeping your Raspberry Pi running smoothly is important for reliable performance in your projects and applications. By regularly checking various health parameters and status indicators, you can monitor your Pi and catch any potential issues early. This helps prevent crashes, lag, corrupted data, or other problems.
This comprehensive guide will teach you how to check the core health areas and status of your Raspberry Pi. We’ll cover vital signs like temperature, voltage, load, storage, memory usage, and more. We’ll also outline troubleshooting steps if any readings seem abnormal.
Overview of Raspberry Pi Health Checks
The main areas to consistently inspect on your Pi include:
- Temperature
- CPU/GPU load
- Memory and storage
- Voltage
- Firmware and hardware status
Monitoring these health metrics enables you to ensure your Raspberry Pi is operating properly. Major deviations in expected ranges can indicate developing issues.
Catching and addressing problems early keeps your projects running reliably. Sudden crashes, data corruption, SD card failures, or application disruption can often be prevented with proactive system health checks.
Why Raspberry Pi Health Monitoring Matters
Like any computing device, Raspberries Pi’s have recommended and safe operating limits. Exceeding these can start degrading system stability and performance over time.
For example, prolonged high temperatures can reduce the Pi CPU’s lifespan. Overloaded SD cards have higher risk for corruption. Insufficient voltage can lead to crashes or unexpected reboots.
Routine monitoring provides awareness before small issues compound into larger problems. This allows you to tweak configurations, reallocate resources, add cooling, or take other actions to keep your Pi in good health.
Health Status vs. Performance Monitoring
While related, system health and system performance focus on different (but complementary) metrics:
- Health status tracks fundamental operating measures like temperature, utilization, voltages, etc. and aims to catch deviations from expected safe ranges.
- Performance monitoring focuses on benchmarks and statistics around throughput, latency, bandwidth, lag, FPS, etc. for apps/services running on the hardware.
Think of health checks as monitoring the “vital signs” of your system, while performance monitoring evaluates operation of specific software programs on that system.
You need adequate system health as a baseline for peak performance monitoring numbers. Degraded health status will eventually drag down performance. We focus on core health status here, upon which you can build performance monitoring.
Checking Raspberry Pi CPU/GPU Temperature
Keeping your Raspberry Pi’s processors cool is critical to stability and longevity. The CPU and GPU temperatures should not exceed 85°C for extended periods.
Here are some best ways to monitor your Pi’s core temperature.
Method 1: vcgencmd in Terminal
The simplest way to check CPU temp is using the vcgencmd command in a terminal window:
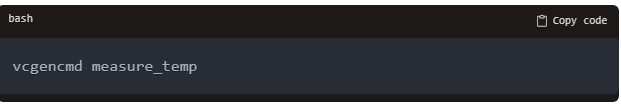
This returns the current SoC (System on Chip) temperature in Celsius.
For reference, idle temperatures in normal room temperature environments should sit around 35-50°C depending on model.
For detecting high spikes over longer periods, you can sample this output on an interval:
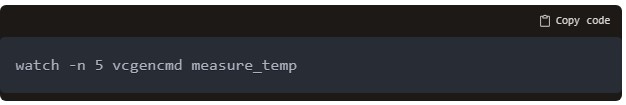
This refreshes the temperature readout every 5 seconds so you can spot heating trends.
Official Raspberry Pi Docs on temperature monitoring
Method 2: GUI Indicators
If using the Raspberry Pi OS desktop environment, several options exist for graphical temp monitoring:
- The taskbar in the upper right shows the current core temp when clicked.
- The
psensorapplication provides detailed graphs and monitoring options for temperature and other system vitals. Access it through the Add/Remove Software utility.
These make it easy to check CPU/GPU temp visually without dropping to the command line each time.
{{Image showing psensor graphs}}
Method 3: Read Direct Sensor Chips
For the most accurate readings, the physical sensor chips can be accessed directly from Python or other code using the following paths:
/sys/class/thermal/thermal_zone0/temp– CPU temp/sys/class/thermal/thermal_zone1/temp– GPU core temp
Open this file, read the value, then divide by 1000 to get degrees celsius.
This shows the sensors underlying what vcgencmd reports. But the simple command line tool is easiest for casual checking.
Monitoring CPU/GPU Load
In addition to temperature, monitoring overall CPU and GPU workload percentages is key. Spikes up to 100% utilization are normal during intense computational tasks.
But sustained high load beyond 95% can indicate insufficient resources. Overheating, throttling, and instability can follow.
Here are some standard options for checking SoC load levels:
Method 1: Top Command
The top command displays dynamic updated process and resource usage statistics:
Focus on the %CPU column for overall system load across all cores from tasks, processes, and interrupts.
Per-core loads can be shown with the 1 hot key, then monitoring each core number.
Method 2: htop Tool
For interactive visual process monitors, htop provides advanced features over standard top:
- Easier navigation with mouse clicks
- Color-coded bars for load
- Tree view for processes
Install htop, then run htop to open the live dashboard. Scan the colored bars and percentages to monitor live utilization.
Method 3: nmon System Monitor
nmon is a full-featured performance monitor with detailed current and historical system statistics. It works in a terminal or uploads data to graphing tools.
To install on Raspberry Pi OS:
Run nmon then n to access the processor menu and view live CPU load levels per core or overall.
RaspberryPi.org guide on using nmon
Checking Memory and Disk Usage
In addition to temperatures and loads, keeping an eye on free memory and storage space remaining is key to avoiding crashes or lag from those resources maxing out.
Here are quick ways to monitor memory and disk utilization on your Pi.
Memory Usage
Check current system RAM usage with the free -h command, which shows totals and breakdowns in human-readable formats:
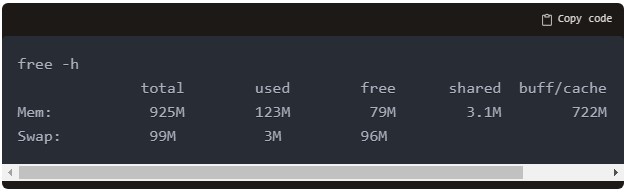
Focus on the “Mem” rows for RAM utilization. Ensure the “available” value doesn’t drop too low during normal operation. This calculates usable memory accounting for cached processes.
The htop tool also visualizes live memory usage.
If you consistently see high RAM utilization, look at increasing allocated memory or optimizing processes and workloads.
Raspberry Pi memory management guide
Disk Usage
Check remaining storage space on connected drives using the df command:
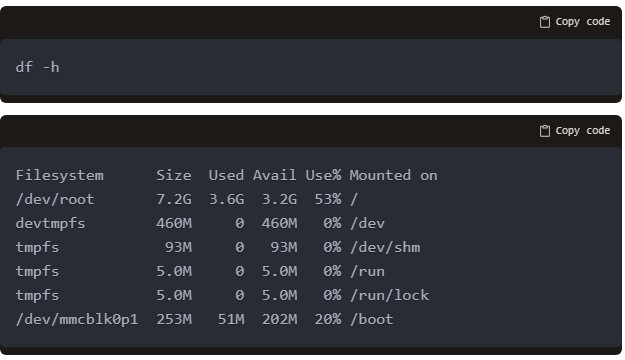
Look at the Use% column for percentage space used on each disk partition. Ensure these are not filling up excessively during operations.
The Raspberry Pi OS desktop system monitor graphical utility provides storage usage graphs as well for quick visual inspection.
Regularly prune unneeded files/data and resize partitions if you consistently see high utilization.
Monitoring Pi Voltages
Stable, clean power is essential for proper Raspberry Pi operation. Fluctuating voltages can lead to crashes, SD card corruption, USB issues, and hardware degradation over time.
While a quality power supply provides steady initial voltages, resistance along microUSB cables and through power regulation components can cause drops under load.
Monitoring your Pi’s input voltages and 3V3 rail helps ensure you’re within the expected 4.75-5.25V range without excessive ripple or noise that could affect stability.
Here are some options for tracking voltages entering and within your Pi.
Method 1: Measure with Multimeter
The most accurate way to monitor exact voltage levels is using a digital multimeter to measure directly across the input/output test points, GPIO, or rail pads.
Be very careful when taking physical voltage measurements on the PCB to avoid shorts.
Typical measurement points include:
- 5V/GND – External power input
- 3V3/GND – Internally regulated 3.3V rail
- GPIO Pins – Should match 3V3 rail
Compare to the reference voltage thresholds in the documentation.
Method 2: Software Voltage Monitors
For simplified monitoring within the OS without a multimeter, tools like vcgencmd or nmon report input voltages:
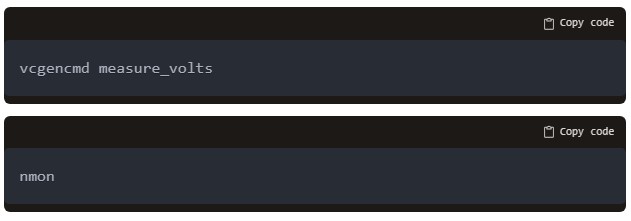
then v – voltages menu
This allows graphing over time to spot inconsistencies without direct hardware access or probing. Just note these readings incorporate some smoothing so aren’t completely accurate.
If your voltage measurements show excessive ripple, instability, drops under load or movement outside the rated input ranges, address your power supply and cabling to prevent electrical issues long term.
Raspberry Pi Voltage Monitoring Details
Checking Firmware and Hardware Status
In addition to actively monitoring utilization and sensors, checking in on firmware and hardware statuses provides visibility into the overall health of your Pi’s physical components.
Issues reported at this level may require physical interventions beyond software optimization.
Review dmesg Boot Logs
Logs from the Linux kernel ring buffer on boot contain status messages and warnings from initialization of the core hardware components.
Review these logs after attaching new peripherals or hardware issues with:
Watch for specific warnings related to undervoltage, I/O and USB issues, temperature spikes, failures initializing devices, and retries/corrections.
Address anything suspicious early before it causes failures down the line.
Common warning signs in dmesg logs include:
Under-voltage detected!retrying using single-word (32 bit) accesseslink is not readynetwork device errors- Many corrected ECC RAM errors
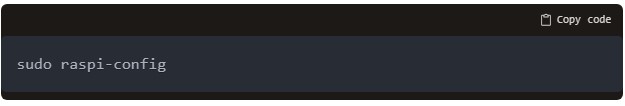
Run raspi-config Tool
The raspi-config tool lets you view status and configure boot options, memory split, localization, and hardware settings:
Navigate through the various menus to:
- Change GPU memory split if seeing allocation issues
- Enable/disable boot to desktop
- Set localization settings
- Enable interfaces like camera, SPI, I2C, SSH, VNC as needed
The tool alerts you to any active issues with specific devices or configurations needing attention.
Query vcdbg Status Commands
Additional hardware status and diagnostics tools are available from the vcgencmd CLI:
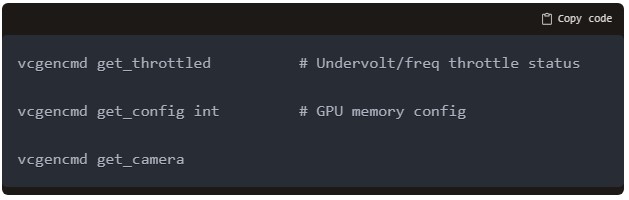
Review issues output here related to undervoltage events, thermal throttling, codec errors, camera failures, display problems and more hardware components.
Official Raspberry Pi Configuration docs
Raspberry Pi Health Monitoring Best Practices
Now that you know various options for checking system health parameters, here are some best practices to follow:
- Set up active monitoring instead of relying on passive checks. Actively record vitals like temperature and load at regular short intervals using commands, scripts or tools outlined. Don’t wait for problems to appear.
- Monitor trends over time, not just spot-checks – record health metrics to benchmark expected ranges for your Pi model, environment, and workloads.
- Plot collected metrics in time-series graphs using Python frameworks like matplotlib to easily visualize changes over days/weeks for faster diagnosis of developing issues.
- Define alert thresholds for danger levels on key vitals like sustained high temperature, extreme loads, steep voltage drops. Trigger alerts if exceeding limits instead of relying on human inspection alone.
- Check voltages under realistic workloads – monitor power quality during actual heavy computational tasks not just idle. Power issues arise most often under operational loads.
- Combine health status monitoring with performance benchmarking of critical services/applications to relate health to actual software/workload efficiency.
- Monitor SD card health parameters separately as a leading indicator of future failures – watch ECC error counters, runtime bad blocks, wear levels.
- Inspect boot logs regularly for hardware status and initialization errors – don’t just monitor runtime vitals. Catch firmware and defective peripherals.
- Check both single parameters and overall system stability indicators like failed processes and crashes in system logs. Failures link back to underlying health factors.
- Remediate issues early when detected – don’t allow temps, throttling, voltage drops or load spikes sustain long term. Prevention avoids later crashes/corruptions.
- Consider dedicated hardware monitors for regulate recording if going remote – don’t rely on CLI checks alone. Watchdogs ensure 24/7 visibility.
Troubleshooting How to Check Raspberry Pi Health
If any of your Raspberry Pi health checks surface abnormal readings or issues, here is a troubleshooting methodology to follow:
Step 1: Retest to Confirm Issue
First validate unusual metrics weren’t just temporary blips or false readings:
- Restart the Pi and re-run health checks clean
- Use multiple tools to cross-validate values
- Take multiple measurements over 5-10 minutes
If anomalous readings occur multiple times with confidence, move to troubleshoot further.
Step 2: Review Environmental Factors
Consider external environmental variables that could contribute to health issues:
- Is the ambient temperature higher than normal?
- Is the Pi physically near heat sources?
- Did the electrical supply/voltage stability change recently?
- Are additional peripherals or USB devices now drawing more power? External drives?
See if removing environmental factors helps restore normal health readings.
Step 3: Check Configuration Issues
Dig into OS, software and tooling configuration for problems that could affect utilization or hardware operation:
- Did memory split, clocks or other firmware settings change?
- Are new or intensive workloads running than prior baseline?
- Are remote monitoring tools or agents adding background load?
Tweak configurations appropriately to isolate internal software issues.
Step 4: Power Cycle Pi and peripherals
If problems persist through software checks, completely reboot hardware.
- Shutdown Pi safely then disconnect/reconnect power cable
- Power cycle connected USB devices/drives and monitors
- Check standalone Pi without peripherals first
See if issue remains on clean reboot without any accessories first.
Step 5: Review dmesg Logs Deeper
Dig into the Linux kernel boot messages and Ring buffer for additional hardware details:
- Scan
dmesglog copies before/after reboot to spot hardware differences - Search logs for ECC corrections, I/O errors, device retries/failures
- Lookup specific error codes reported
Low level warnings here point to physical issues.
Step 6: Switch SD Cards
If software factors ruled out, replace the SD card with a known good spare:
- Backup important data first
- Boot Pi from verified working card
- See if issues persist on new OS install
Many “hardware” failures trace back to failing SD cards long term.
Step 7: Consider Hardware Repair/Replacement
If problems remain after isolation steps above, physical hardware damage may have occurred requiring repair:
- Overheating can degrade CPUs over time
- Undervolt ripples increase transistor oxidation
- Faulty USB-C power supplies provide unstable power
Request Raspberry Pi hardware support for returns/replacements if under warranty. For custom assembled Pis, replace damaged components.
Catching problems early allows fixing issues before they brick boards fully. Monitor health metrics diligently to enable reactive maintenance.
Healthy Pi = Happy Pi
Like maintaining your own physical health with checkups and care, keeping tabs on Raspberry Pi status indicators helps sustain reliable, long-lived operation of your devices.
Put a few monitoring tools in place, then review metrics weekly at minimum to stay ahead of problems. Give your Pis the tools and attention needed to thrive for future projects. Healthy Pi, happy Pi!